SENSQUANT VISUALIZER
SensQuant Visualizer simplifies the complexity of industrial water and RO process data. It allows you to explore and interact with your full dataset—without assumptions, sampling, or reduction. High-dimensional operational data is transformed into a 3D point cloud using advanced machine learning algorithms to uncover hidden insights.
Millions of data records
Source data includes pressure, flow, conductivity, and recovery rate readings from RO and water treatment systems. Collected every seconds across multiple sensors, these measurements accumulate into tens of millions of entries—impossible to manually interpret.
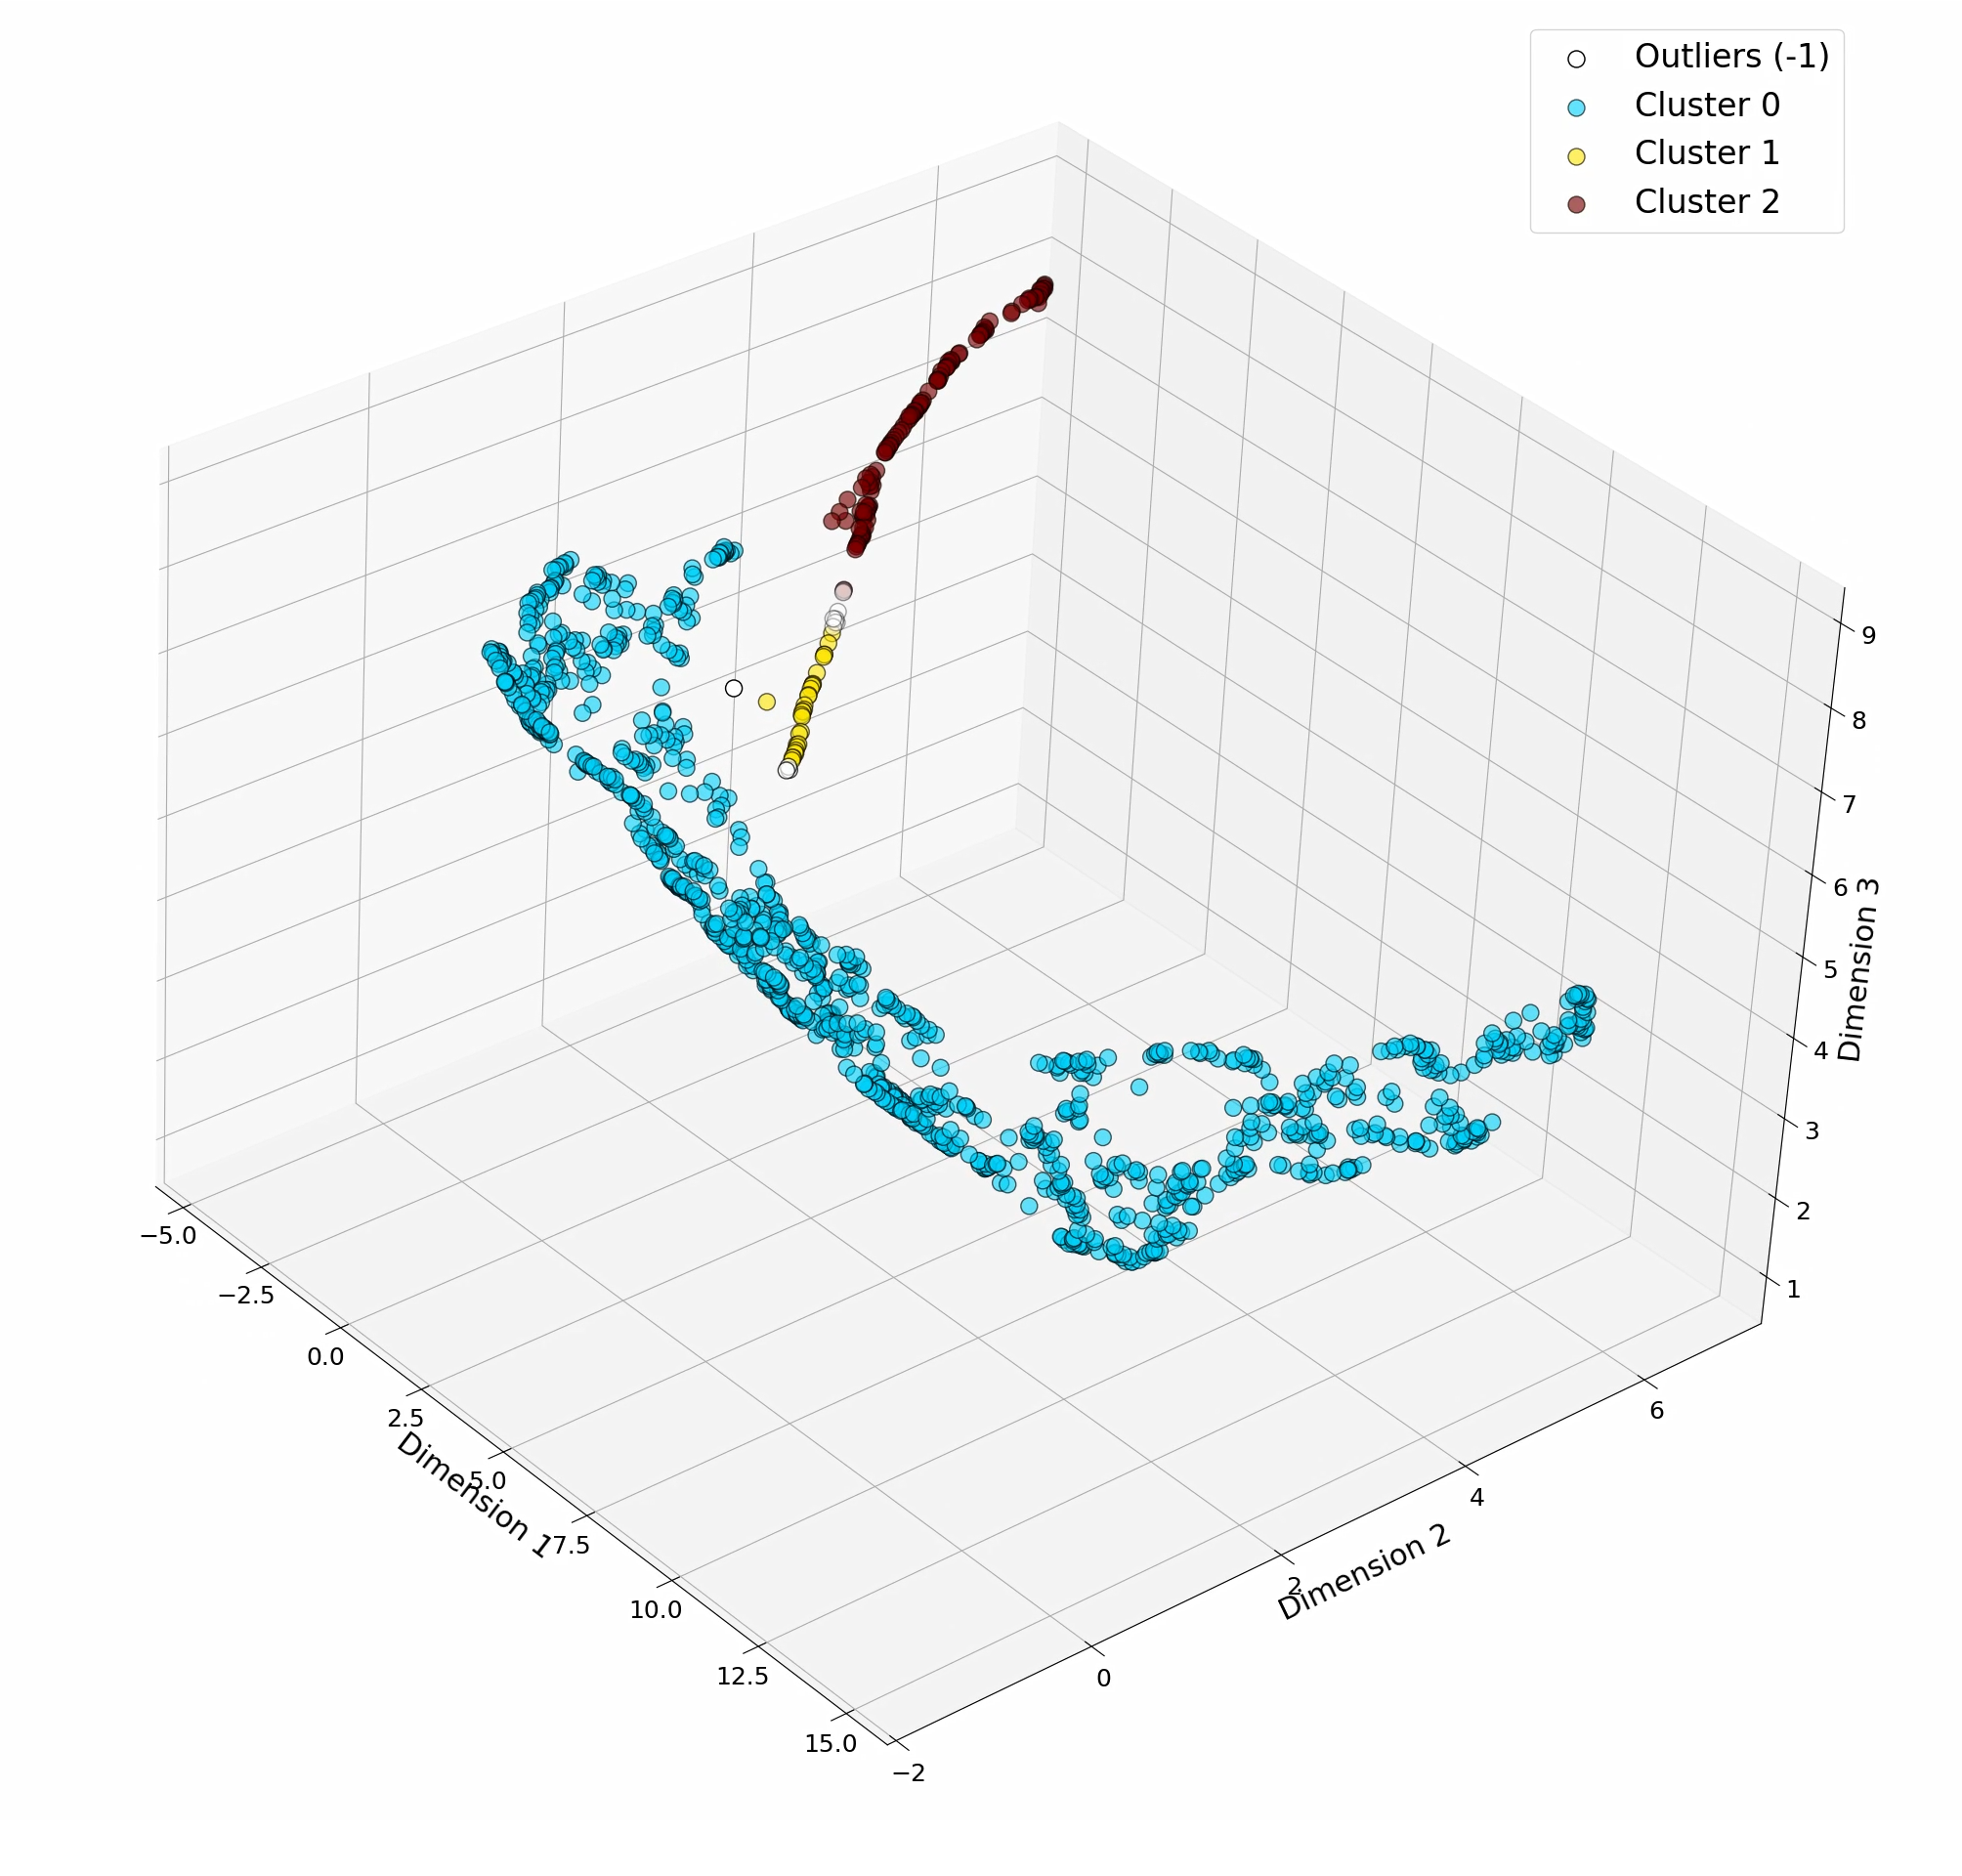
3D DATA POINT CLOUD
SensQuant converts millions of datapoints into a 3D point cloud for visual pattern recognition. Each point represents sensor values at a specific time and unit. Clusters reveal process behaviors, while overlaid KPIs highlight anomalies, fouling trends, and performance zones—enabling smarter decisions and early intervention.